Zero-Code Distributed Tracing into TrueWatch with OpenTelemetry eBPF Instrumentation
End-to-end traces from services you never touched, with one DaemonSet and four environment variables. What we measured on a small Kubernetes lab, and the sharp edges worth knowing before you roll it out.
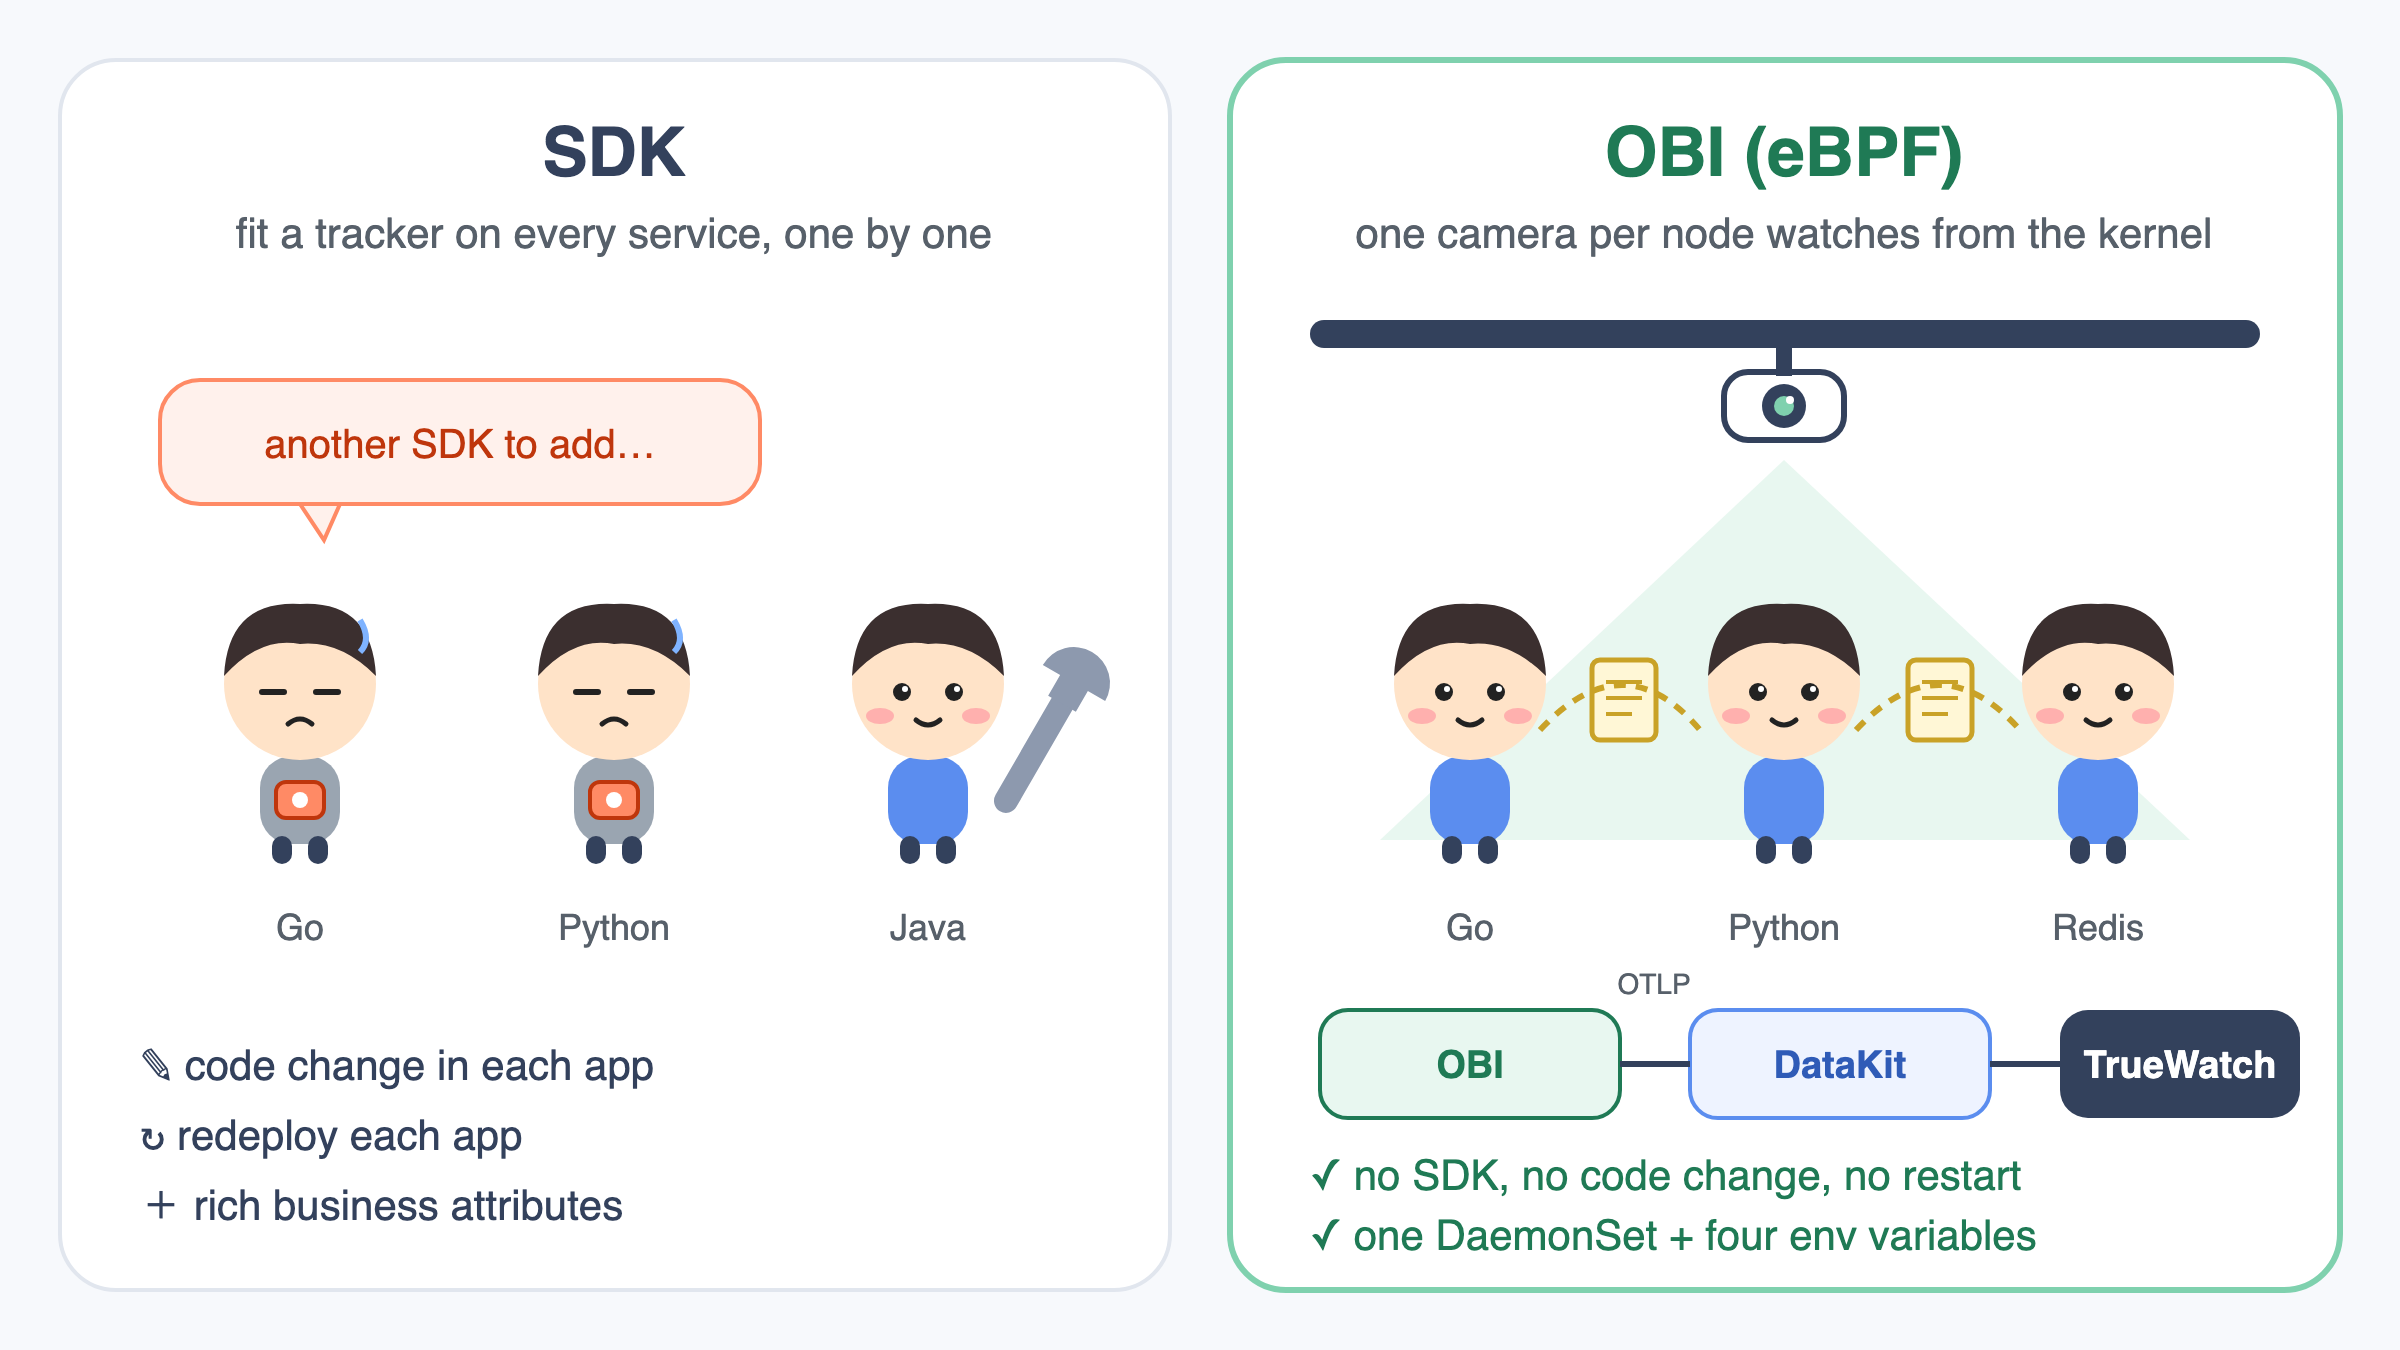
You can get end-to-end traces from services you never touched, and land them in TrueWatch, with one DaemonSet and four environment variables. We tried it this week on a small Kubernetes lab, and it worked better than I expected, with a few sharp edges worth knowing before you roll it out.
What OBI is
OpenTelemetry eBPF Instrumentation (OBI, which Grafana Labs donated to OpenTelemetry in 2025 from its Beyla project) watches your processes from the kernel with eBPF. It recognizes HTTP, gRPC, SQL, Redis and more, builds OpenTelemetry spans and RED metrics, and exports them over OTLP. No SDK, no code change, no restart of the app.
TrueWatch already speaks OTLP: DataKit’s opentelemetry input accepts traces and metrics on its /otel endpoint. So the integration is just “point OBI’s exporter at DataKit”.
The setup
A two-node k3s cluster, a Go frontend, a Python backend and Redis. None of them had any tracing code. OBI ran as a DaemonSet, not privileged, with these settings:
1
2
3
4
5
OTEL_EXPORTER_OTLP_ENDPOINT=http://datakit-service.datakit.svc.cluster.local:9529/otel
OTEL_EXPORTER_OTLP_PROTOCOL=http/protobuf
OTEL_EBPF_BPF_CONTEXT_PROPAGATION=all
capabilities: BPF, PERFMON, SYS_PTRACE, NET_RAW, NET_ADMIN, DAC_READ_SEARCH, CHECKPOINT_RESTORE, SYS_ADMIN
hostPID: true, hostNetwork: true, host /sys/kernel/tracing mounted
On the DataKit side, the only requirement is that the opentelemetry input is enabled.
What we measured
- Same node: 200 of 200 requests became one connected trace, frontend → backend → Redis.
- Across nodes: 150 of 150 requests stayed one trace even though the frontend and the backend ran on different machines. The trace id reached the Python backend as a W3C
traceparentheader, which OBI’s Go instrumentation writes itself. So this shows Go-to-anything propagation; it does not yet show OBI’s language-neutral TCP-level path working between nodes. - On the wire: the backend received a real W3C
traceparentheader on every request, and its trace id was exactly the trace id shown in TrueWatch. That means your application logs can be joined to the trace without touching the logger. - Cost: 11 to 15 millicores of CPU and 270 to 420 MiB of memory per node at about 5 requests per second for three services.
The sharp edges
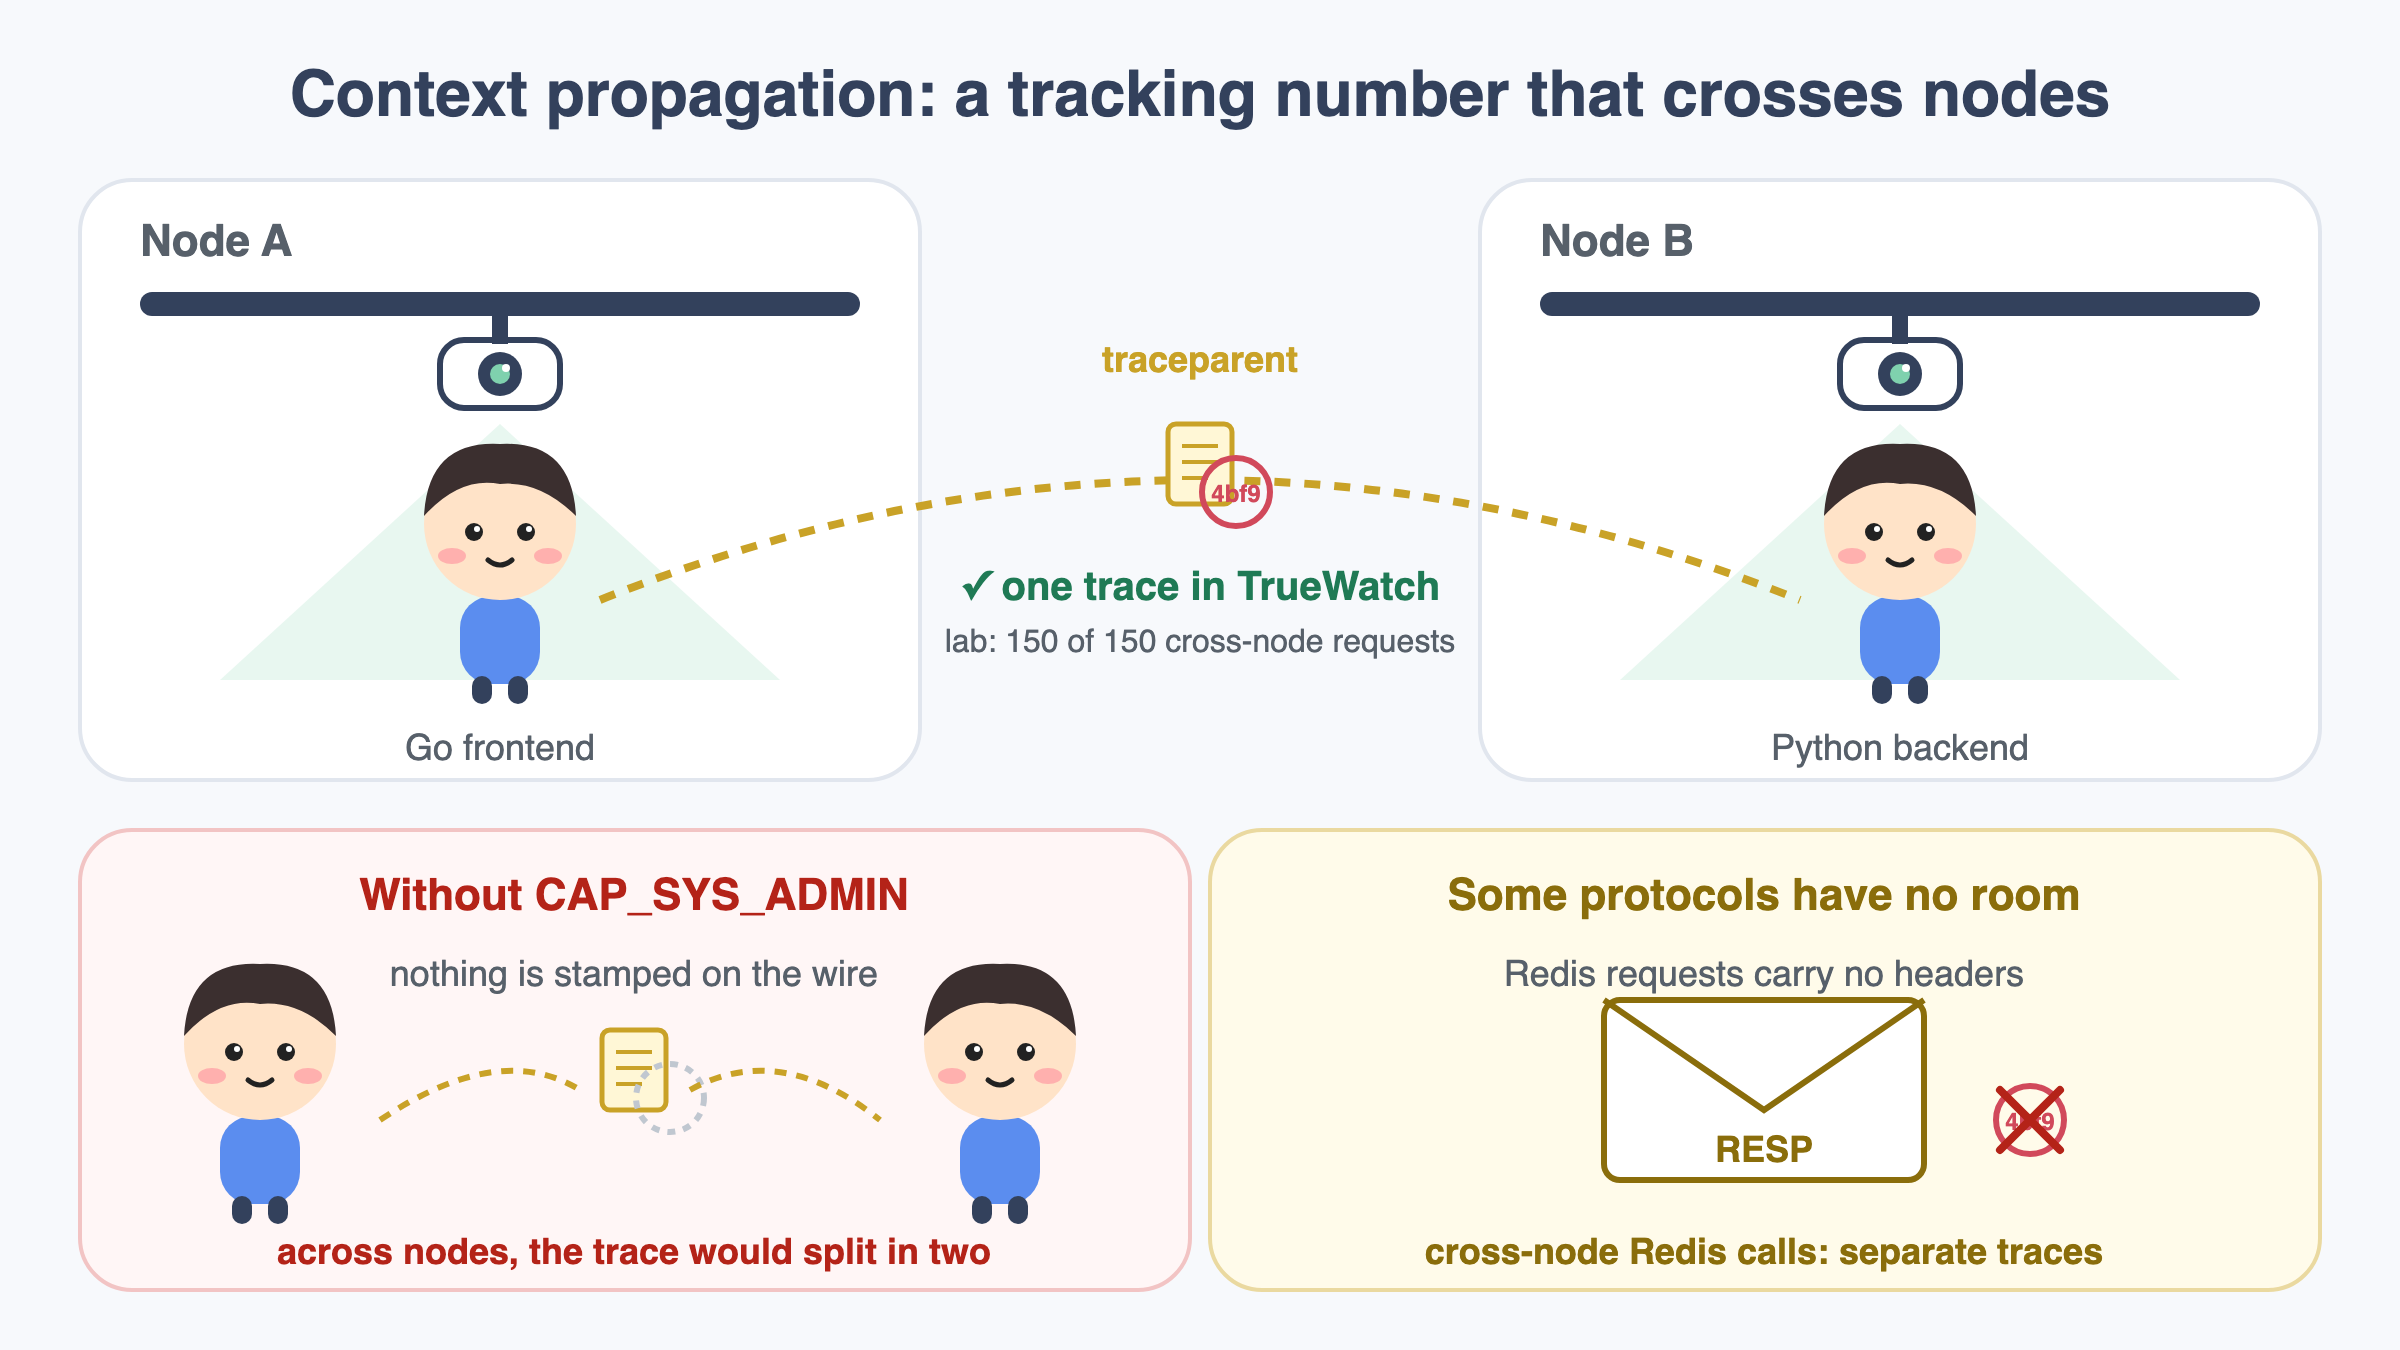
- Context propagation needs CAP_SYS_ADMIN. Without it, traces still looked connected in our first run, but only because one OBI instance saw both sides on the same node. Nothing was injected on the wire, so a cross-node hop would have split the trace. Check the downstream request headers, not just the trace view.
- Recent kernels need tracefs. On kernels from 6.18.14 (also 6.12.75 and 6.6.128), OBI’s network-level propagation relies on a fix-up that needs SYS_ADMIN and a mounted
/sys/kernel/tracing. Without it, OBI logs an error, turns propagation off, and keeps sending traces, so it is easy to miss. - Not every protocol carries context. Our Python-to-Redis call across nodes produced separate Redis traces: there is no header in RESP to carry a trace id.
- Metric names keep their dots. OBI’s RED metrics arrive in TrueWatch with names like
http.server.request.duration_count, so dashboards and queries need to quote them. - Expect a few extra internal spans (“in queue”, “processing”) per request in Go services.
When I would use it
- Services you cannot or will not instrument: third-party binaries, legacy code, a polyglot estate where adding an SDK to every language is a project in itself.
- A first pass at a service map before investing in SDK instrumentation.
- Correlating logs and traces in apps that already log incoming headers.
When I would still use an SDK: business attributes on spans, custom spans inside a function, and anything that needs sampling decisions made in code.
OBI is still at v0, so pin the image digest and test it on your own kernels first. But as a way to see what your services are doing on day one, eBPF plus OTLP plus TrueWatch is a very short path.